Video Analytics 101
Hari Krishnan - January 23, 2023 - Leave your thoughts.
Video analytics is not limited to superficial statistics such as likes and comments. A truly intelligent video analytics software helps you glean insightful data about your viewers that will catapult your marketing, sales, and business strategy to new heights. In this article, we will dive deep into the world of video analytics.
Sharing Videos across your marketing channels for better conversions is a no-brainer. The numbers about the power of videos speak for themselves. A staggering 94% of marketers admit that videos help them explain their products in a better manner.
There are a plethora of platforms such as YouTube and Dailymotion to upload your videos. However, their video analytics is limited to likes, dislikes, views, and comments. A true-blue video analytics tool offers you a lot more.
Before diving into how ingenious video analytics can help you, let’s have a look at what is video analytics.
What Is Video Analytics?
Video analytics is the process of using software to analyze, discover and break down the value you are getting from your views. A video analytics tool must provide data beyond generic information such as views, likes, and comments.
Incisive video analytics includes consumption stats, engagement stats, conversion reports, and individual viewers' stats. It might sound too much to ask for. However, Show’s video hosting platform provides in-depth video analytics and much more.
Let’s have a look at the different types of video stats you can access with a video analytics tool.
Different Types of Video Statistics
Here are the different types of video statistics that you will get with Show’s video analytics.
- Video Consumption Statistics
As the term suggests, these are video statistics that are based on how much your videos have been watched by the audience. There are different types of video consumption stats:
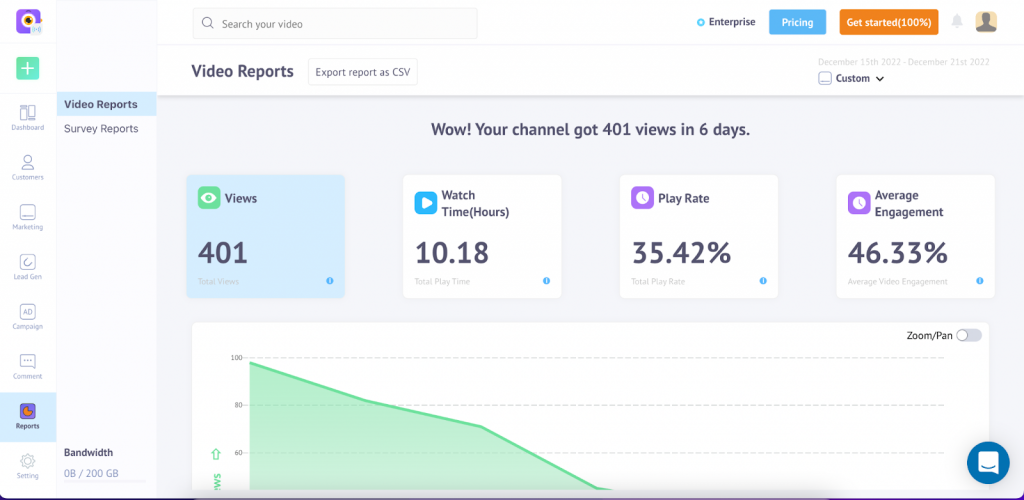
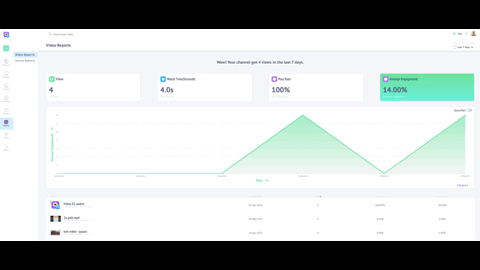
(i) Video Summary: The video summary page summarizes the consumption of your video. It includes statistics such as views, watch time, and the average engagement rate of your videos.

(ii) Views: This shows the total number of views all of your videos have had for the selected time.
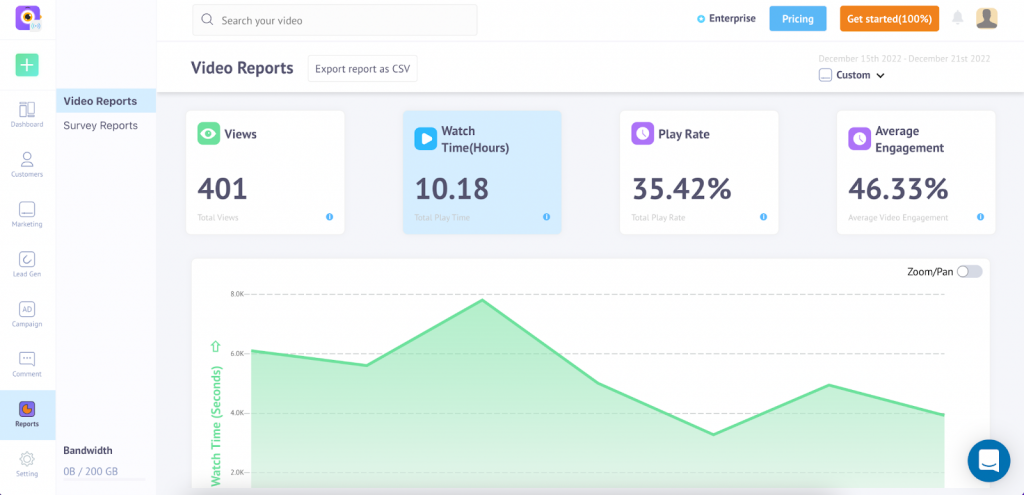
(iii) Watch Time: This statistic will give you the total hours of the time your video has been watched according to the time period selected.
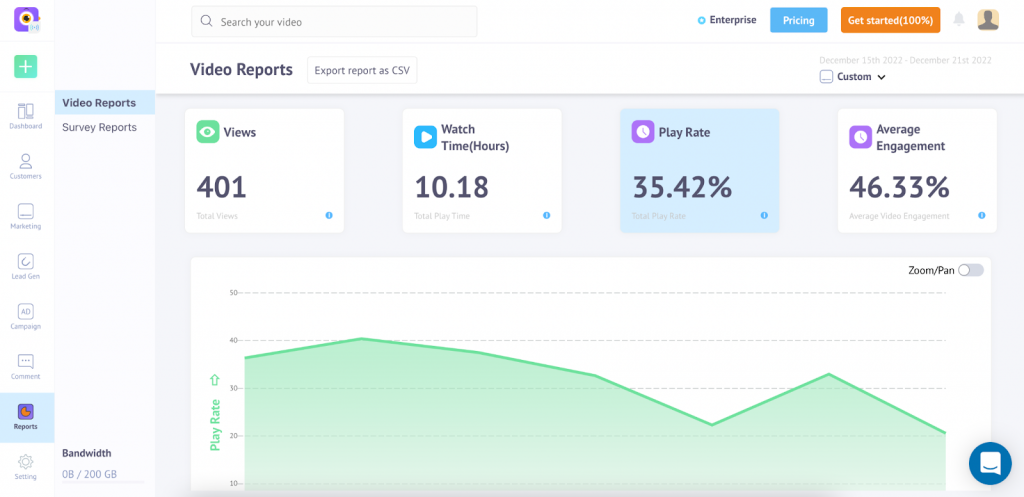
(iv) Play rate: This statistic shows the number of unique viewers who have watched your video compared to the number of unique visitors on your video page. This statistic is calculated by dividing unique visitors and unique watchers.
- Video Engagement Stats
Video engagement stats inform you how attentive viewers were while watching your videos.

The following stats are engagement stats:
(i) Average engagement rate: The average engagement rate stat on Show’s dashboard gives you data about how attentive viewers are to your videos.
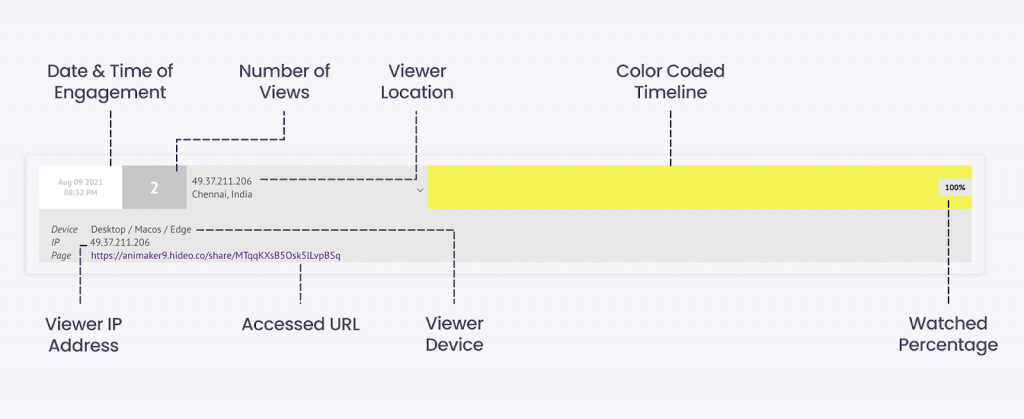
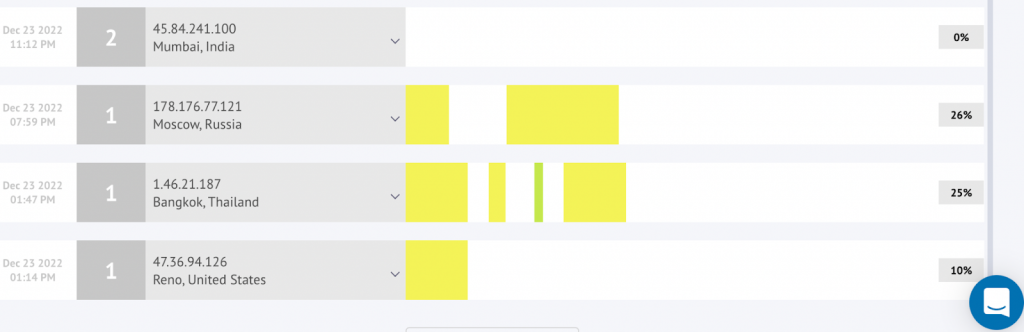
(ii) Heatmaps: Video heatmaps are a detailed view of every single viewer’s experience with your videos. You get to know which parts of your videos are working.
The heatmaps provide basic information about the viewer and in-depth viewing patterns of every viewer. The basic information in heatmaps is
- Date and time of engagement: You get to know the time and date your viewer watched the video for the first time.
- The number of views: The number of times the viewer has watched the video in a particular session.
- Viewer data: In this section, you get information about the viewer such as their location, device, IP addresses, and the URL they accessed to watch this video.
- Percentage of video played: Find this at the extreme right section of the heatmap. This indicates how much of the video has been accessed by the viewer.
- Conversion Reports
As the term suggests, these reports show how the interactive hotspots of your videos are performing.
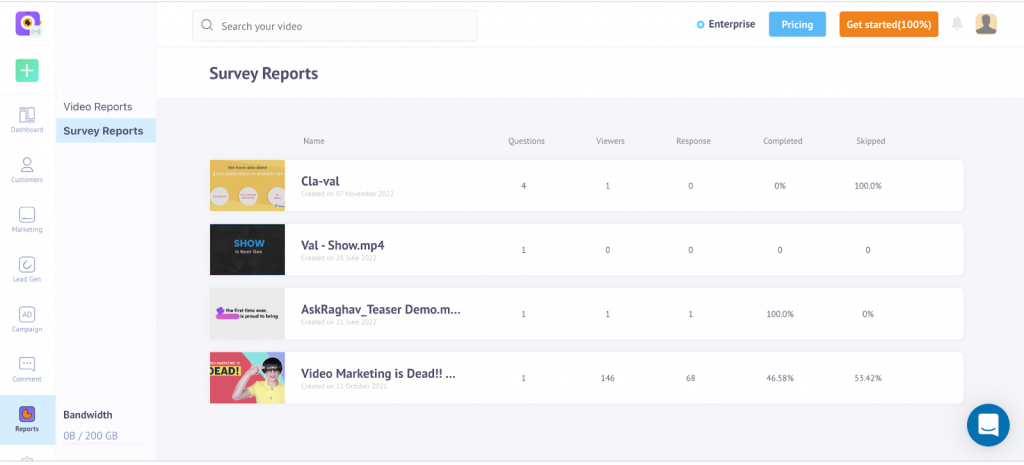
(i) Survey/Poll reports: Yes, you read that right. Your video can now have interactive hotspots such as surveys, polls, and CTAs. It is a great way for your business to gain insights about your product.
On the Show platform, not only can you place interactive hotspots in your video but you can also view your audience’s responses to them.
(ii) Lead generation and form reports: Lead generation is the most challenging part of their jobs according to 61% of marketers. Yes, videos are widely watched. Your videos might be perfect and drive the message across to your viewer. However, expecting your audience to fill the form lying in your video description is a fallacy.
Show allows you to place lead generation forms in your videos. In addition, you can also have access to the filled forms at your disposal.
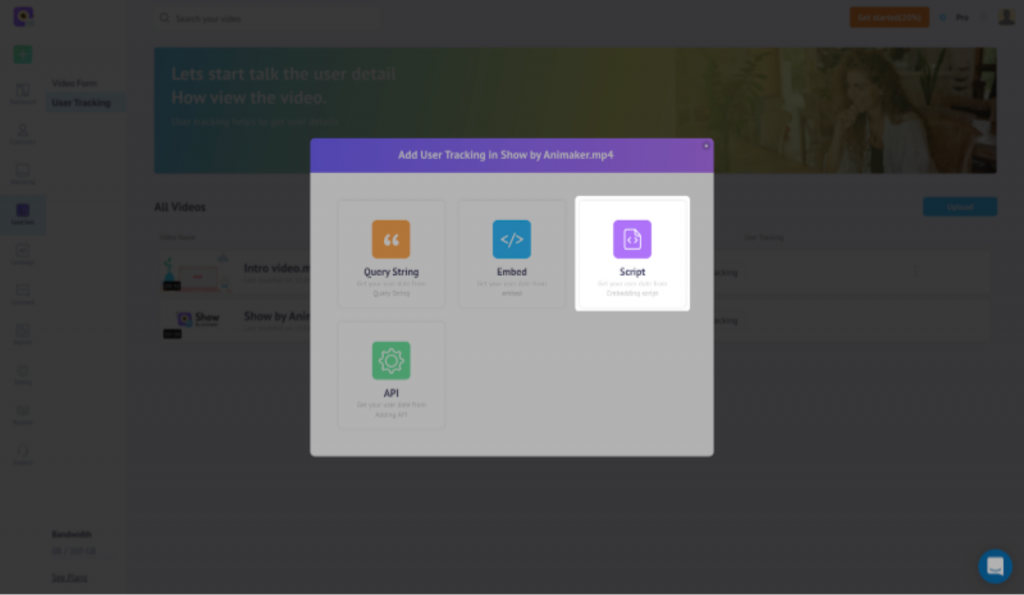
(iii) Omniscript tracking: Tracking your customer’s actions is easier said than done. However, with Show’s Omniscript tracking feature, all you have to do is select the type of tracking you want to do, copy the script from your Show dashboard and install it on your website. It’s built to work with or without a video player, so you’re getting video-level analytics and a way to visualize every critical action being taken on your website.
- Viewer Stats
We know that more than getting hands-on only video-related statistics will be required. To have better information about your audience, you should also know information about every viewer of your videos. An efficient video analytics tool will help you get in-depth data about the viewers.
There are different types of viewer stats that you can get your hands on.
(i) Demographic stats: As we already saw in the screenshot above you get information such as the location of the viewer, IP address, and the device through which the user accessed your videos.
This information is really useful to glean demographic information about your prospective customers. It can also be used to gauge whether your videos are reaching your target audience in terms of demographics.
You can also add interactive hotspots such as polls, surveys, and forms to get more information such as the age and gender of your viewers.
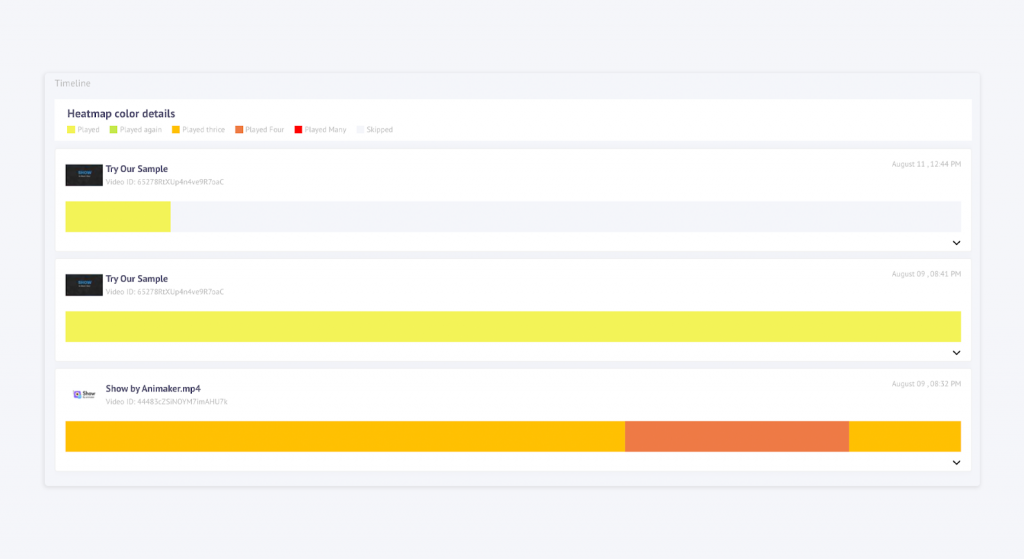
(ii) Heatmaps: Heatmaps are a wonderful way to know about the viewing patterns of your audience. You can know how much your viewer has watched, skipped, and consumed more than once of a particular video. You can also know how much % of your videos have been watched by each viewer.
Heatmaps can be used to know how much of your video is working. You can gain more insights about your viewers if you juxtapose viewers’ heat maps with their demographic information. You can understand and segment the viewing patterns of your audience geographically.
Benefits of Video Analytics
The benefits of video analytics cannot be overstated. Advanced video analytics is already changing the world of business. Let’s have a look at the advantages of video analytics.
- In-Depth Customer Insights
Generally, the only takeaways from video analytics are your likes, dislikes, and comments stats. However, Show takes it a step beyond your superficial stats. As we saw above, we get our hands on insightful stats such as play rate, avg view time, average engagement, etc.
We also get access to viewer stats such as their demographics and heatmaps. Gleaning such incisive stats consolidates our position to make strong data-based decisions.
- Enabling Marketing Automation
Not only does Show have a native CRM, but it also has integrations such as HubSpot and Salesforce. To help you access video stats at your convenience, you can also access and export the CSV file of your video reports.
Not only do you get incisive video analytics, but we also make it accessible for you with ease. The availability of such information at your fingertips enables the ease of marketing automation for you. For instance, you can set up a drip campaign based on the viewing patterns and demographic data of your viewers.
- Viewer Insights and Customer Segmentation
We have already seen how you can know about the viewing pattern and demographic information of each viewer. Use the same information to profile your customers and segment them accordingly.
Gaining insights on each customer and profiling them will help you know if there is scope for improvement in your videos. It does not stop there. If done properly, you can also use interactive hotspots to get information such as net promoter score(NPS), product-market fit, and more.
- Provide a Personalized Experience
Today’s world seems to lack human connection. However, by nature, humans are social animals. A personalized experience in marketing or sales can go a long way in building that special connection with your customers and prospective customers.
Viewer stats help you gain information about how each member of your audience is consuming information. The heatmaps help you with individual viewer engagement on every video of yours. Analyzing that information can help you provide a tailored experience to every customer.
- Beyond Superficial Stats
Generally, video statistics are limited to generic stats such as likes, dislikes, and comments. However, these statistics provide you with a blanket statement without offering you any nuances. They do not offer you any eye-openers about user engagement, interaction, and patterns with your videos.
On the other hand, advanced video analytics help you with numbers that can help your business. You can also know whether your videos are working.
Videos without proper video analytics can be equated to a shot in the dark. Even if you are attracting eyeballs with your video, you have no way of knowing whether the eyeballs will turn into customers or not. Video analytics indicate if you are heading in the right direction.
- Time and Cost Saving
Detailed video consumption stats, video engagement stats, conversion reports, and viewer stats are all under one roof. Video analytics provides you the impetus to center your marketing strategy around videos. You do not need to be all over the place to gain insights. In short, you can save loads of time with video analytics software.
Generally, you pay loads of money for marketing tools to automate your marketing process. In the case of a video marketing platform such as Show, you are getting everything within one dashboard, helping you gain savings on cost, time, and effort.
- Increased Revenue
Yes, it is not rocket science that saving money and time will help you increase revenue as well. However, that’s not the only reason why you will save money with video analytics. As we discussed before, we are also gaining a lot of insights into our audience. This helps us tailor our business, sales, and marketing strategy accordingly.
Learning from video analytics helps us have a finger on the pulse of our audience. Every business needs to be customer-centric to increase its profits. Video analytics helps your business become more customer-centric than ever before.
Application of Video Analytics
Knowledge is not power. Applied knowledge is power. We have learned about video analytics and its numerous benefits. That does not mean we are completely equipped to use it in our businesses. Let’s have a look at how we can use video analytics for the betterment of our businesses.
- Marketing Campaigns
Video analytics can be a great way to gain insights from marketing campaigns. Right from video statistics to viewer heatmaps, video analytics is a goldmine for customer segmentation.
In addition, it is of great help to gather information about the success of your marketing campaigns through video analytics. With color-coded heatmaps, you know the parts of the videos that are working in contrast to the portions of the videos that are not.
- Lead Nurturing
Video analytics helps you track viewer engagement. You understand the key moments in the video that are captivating the viewers. You can proceed with your lead nurturing campaign according to the data you have collected from your video analytics tool.
You can personalize the experience for each of your viewers by using viewer stats and analyzing them. For instance, if a viewer has watched a particular video repeatedly, you can send him/her emails related to that video.
- Product Explainer Videos
Video analytics of product explainer videos can be used in the same way as they are used for marketing campaigns and lead nurturing campaigns. Viewer engagement can be tracked to know the key moments in your videos that have worked, and you can personalize your marketing and outreach campaigns according to the viewers’ engagement.
How Advanced Video Analytics Is The Present and The Future
Artificial intelligence and machine learning are growing at a breakneck speed with each passing day. The same can be said for video analytics. Video analytics is the present. With improvements regularly, video analytics will also evolve and become a more prominent part of our business strategies.
The global video analytics market is expected to grow at a compound annual growth rate of 20.4%. It is expected to reach USD 14.9 billion by 2026.
At Show, we constantly strive to serve our customers in a better manner. Hence, our roadmap has already prioritized further development of advanced video analytics.
Conclusion
The consumption and production of videos are growing at an unprecedented rate. On the positive side, businesses have been capitalizing on videos as a marketing tool since time immemorial. However, most of them have not been able to keep track of how effective their videos are. Get a demo right away to know how Show helps you get in-depth video analytics for your videos.